Indicator for Full Time Frame Continuity: Mastering MTFA
The market trends within trading and investing can be perceived and predicted effectively by an investor to make appropriate decisions. One of the strong ways one can achieve this is through Multi-Time Frame Analysis. This article describes the Indicator for Full Time Frame Continuity and how mastering MTFA can substantially affect your trading strategies.
Introduction
Brief Overview
MTFA stands for the analysis of market data in higher time frames to perceive the bigger picture of market trends. This will provide a better view of the market’s trend or direction and strength using different time frames.
The indicator helps in confirming whether the trends in the shorter time frames match the trends occurring in the longer time frames and, therefore, aids in full-time frame continuity. This is important in verifying the trends and filtering the misleading signals of the trend.
Purpose of the Article
The coming article will give you deep insight into the full-time frame continuity indicator: its importance, how it is integrated in the MTFA, and best practices using it. In this review, understand how to apply this indicator to improve the trading strategy and make the best decision.
What is a Full Time Frame Continuity Indicator?

Basic Definition and Importance
Continuity of the full-time frame indicator is a tool for verifying consistency in the trend for all higher time frames. For trading, it helps to confirm that any strength of the trend or to avoid false signals is consistent through higher time frames.
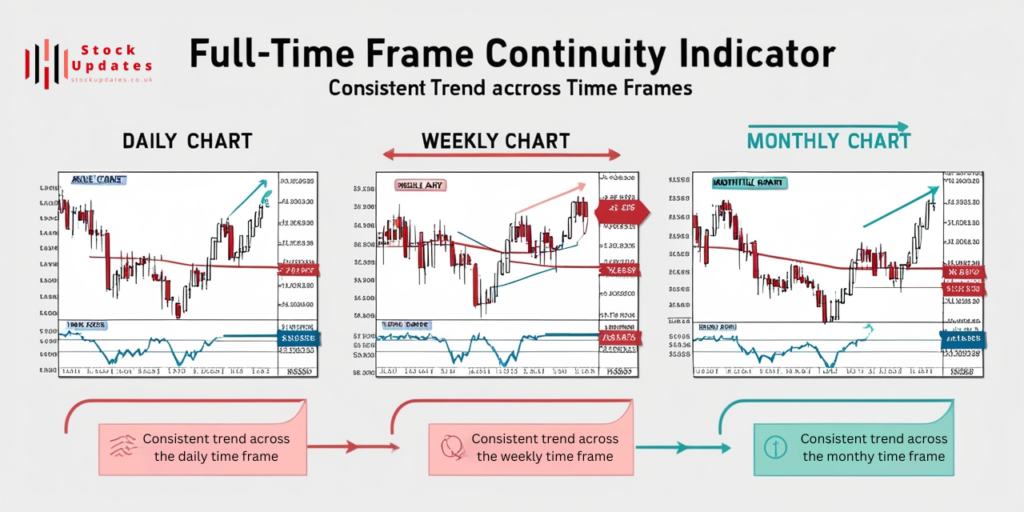
For instance, a trend observed on a daily chart must be supplemented with the same trends reflected on the weekly or monthly charts. Such continuity gives far greater assurance in the reliability of the trend and allows drawing much more accurate forecasts.
Advantages of Continuity
Continuity across timeframes has the following advantages:
- Improved Accuracy: Through the application of trend analysis on multiple timeframes, traders can lower the likelihood of relying on erroneous signals for entry/exit decisions.
- More Reliable Trend Confirmation: A trend that can be seen in more time frames is more likely to be reliable and more durable.
- Better Decision Making: More consistent trends provide more reliable clues on when a decision has to be made either to enter or to exit a trade.
The full-time frame continuity indicator ascertains that the trends you follow are not mere temporary fluctuations but part of an extensive, more reliable trend.
Understand MTFA Multi-Time Frame Analysis

Basics of MTFA
MTFA is a technique of analysis that refers to observing the price movements in more detail across multiple time frames. The very backbone of using MTFA is to observe higher and, in turn, lower time frames to develop a more complete view of the market trends.
For example, the trader can take up the daily chart to identify the short-term trends. He also needs to consider a chart on a weekly basis that assists in perceiving medium-term trends and, simultaneously, goes ahead to take a chart on a monthly basis that allows him to perceive long-term trends. In this way, a trader can make a better decision with the help of the two different standpoints.
Common Time Frames Used
MTFA traders continue to repeatedly use the following time frames:
- Daily (1D): This frame provides information on the short-run movement of prices and trends.
- Weekly (1W): This setting gives a view of the bigger, medium-term trend and can help assess the general direction of the market.
- Monthly (1M): This setting shows the very long-term trend and assists in understanding the bigger market picture.
All time frames have their importance. The everyday outline might show that a stock has as of late been in an upswing, yet the week by week graph might show the stock is in a more extended term downtrend. The two diagrams could be utilized together to foster a comprehension of what the market is doing.
Indicator for Full Time Frame Continuity: Key Components

Types of Indicators
A number of indicators may be employed in ensuring full-time frame continuity. These are:
- Moving Averages: These indicators smooth out the price data and calculate tendencies. The 50-day moving average and 200-day moving average are some of the commonly use moving averages. They help a trader know whether or not a trend is flowing through different time frames.
- Trend Lines: In drawing the trend lines among various charts, this indicates the direction and strength of trends. Trends where the drawing of lines is consistent across multiple time frames signal a strong and consistent trend.
- Oscillators: These are pointers, for example, the RSI and the MACD, which will help in recognizing the pattern’s solidarity and energy. They confirm whether what was perceive in the shorter time frame is indeed consistent with those in the longer time frames.
How These Indicators Work
- Moving Averages: Moving Averages smooths out price information and makes the trend easier to see. For instance, assuming the 50-day Mama is over the 200-day Mama, this shows that the pattern is bullish. Confirmation of these two levels in higher time frames sets confirmation of the trend.
- Trend Lines: Drawing trend lines to connect major price levels is next. A pattern line that is all together on the day to day graph and which concurs with a similar on a week by week diagram shows strength and steadfastness for the continuation of the pattern.
- Oscillators: These are those indicators which essentially gauge momentum and overbought/oversold conditions. For instance, the RSI at an overbought condition on a daily timeframe that is not happening at the weekly time frame is more than likely to give a reversal or correction in the trend.
Learn How to Trade the Indicator for Continuity of Time Frame

Step-by-Step Explanation
- Select Time Frames: Identify what time frames your analysis will be based on. You might need to put together your investigation with respect to day to day, week after week, and month to month graphs.
- Apply the Indicators: The chosen indicators-moving averages, trend lines, oscillators-are applied to the charts.
- Evaluate the Trends: With the indicators applied, begin evaluating the trends on the various time frames. Decide whether your indicators give a uniform signal on the charts.
- Make Decisions: Take the authenticated trends and make correct trading decisions. Enter the trades when the trend shows consistency, whereas exit and make any position adjustment whenever a divergence is seen.
Setting Up Charts
- Choose a Trading Platform: Choose that trading platform which can show you the different time frames and apply multiple indicators.
- Add Indicators: Add moving averages, trend lines, and oscillators on your charts. Optimize the settings as per your trading strategy.
- Signals Interpretation: Assess for signal confluences across time frames. For example, a bullish signal occurring on both daily and weekly charts strengthens the case for a buy trade.
Case Studies and Examples
Real-World Applications
Now, imagine that a trader uses an indicator with full-time frame continuity for the analysis of some sort of uptrend. The daily chart catches the uptrend with the bottom support given by the rising moving average. The weekly chart maintains the bullish trend with a consistent moving average. He would buy the stock once he knew the strength of the trend that occurs in higher time frames.
Success Stories
One trader used MTFA along with the indicator for full time frame continuity on a major tech stock. He saw that all time frames, from the daily to the weekly to the monthly charts, were confirming a very strong uptrend. He went long and caught tremendous gains on the continuation of such trend.
Challenges and Considerations
Common Pitfalls
- Depending Too Much on Indicators: Decision-making solely on account of indicators and without considering other types of analysis, is sure to result in improper decisions. Consolidate indicators with different types of examination.
- False Buy/Sell Signals: Pointers can give misleading purchase/sell signals in the event that markets are extremely unstable. Check for consistency of the signals across higher timeframes before taking a trade.

Best Practices

- The Combination of Indicators: One should confirm the trends using a combination of indicators. For example, one can use moving averages in combination with oscillators for a better view.
- Stay Informed: Keep yourself updated about the market news and events that may affect the trend. Update your analysis accordingly.
- Practice and Refine: Make regular practice part of using MTFA and an indicator for continuity of all time frames. Refine your technique in light of your encounters and results.
Comparative Analysis: Full-Time Frame Continuity Indicator vs Trading View Indicators
| Aspect | Full-Time Frame Continuity Indicator | Trading View Indicators |
| Purpose | Ensures trend consistency across multiple time frames to confirm trend reliability | Offers a wide range of tools for analyzing price trends, momentum, and market conditions |
| Key Components | Moving Averages, Trend Lines, Oscillators | Moving Averages, Trend Lines, Oscillators, Volume Indicators, Custom Scripts |
| Application | Used to verify that trends observed in shorter time frames align with longer time frames | Used for various forms of technical analysis including trend identification, momentum, volatility, and market strength |
| Time Frame Analysis | Focuses on consistency across multiple time frames (e.g., daily, weekly, monthly) | Can be applied to any time frame but individual indicators often focus on specific aspects (e.g., short-term momentum) |
| Indicators Used | • Moving Averages: 50-day, 200-day • Trend Lines: For trend direction • Oscillators: RSI, MACD | • Moving Averages: Various periods • Trend Lines: Customizable • Oscillators: RSI, MACD, Stochastic • Volume Indicators: Volume, OBV • Custom Scripts: User-defined indicators and strategies |
| Signal Confirmation | Confirms trend strength and validity by checking alignment across time frames | Provides signals based on specific criteria, which may or may not be consistent across multiple time frames |
| Integration | Integrates signals from multiple time frames to assess trend continuity | Can integrate with other indicators and custom scripts but often operates within a single time frame unless manually compared |
| Best Use Case | Ideal for verifying that trends are not temporary and ensuring broader trend reliability | Versatile for various types of analysis including short-term trading, trend analysis, and market momentum |
| Example | A bullish trend confirmed on daily, weekly, and monthly charts | A Moving Average crossover on a daily chart, a MACD signal on a 4-hour chart, or volume spikes indicating strong market moves |
| Customization | Generally fixed indicators tailored for continuity across time frames | Highly customizable with various built-in and user-created indicators and strategies |
| Trading Platform | Can be applied on various platforms but requires manual setup for multi-time frame analysis | Available directly on Trading View with extensive library of built-in and community-developed indicators |
Conclusion
Summary of Key Points
Another important tool for MTFA is the full-time frame continuity indicator, which can ensure whether a trend is continuous in various time frames. All this adds value to the trader in ways such as better accuracy and reduced potential for false signals. This will surely add more power to your trading strategy if properly understood and applied.
Final Thoughts
Adding the full-time frame continuity indicator to your trading strategy can lead to better decision-making, thus successful trades. Take this article as a lesson and add it to your analysis, constantly perfecting your approach. After all, success in trading requires that one learns day in and day out.
Read more about Trade at Stock Updates.


Post Comment